internal tooling · airtribe
vision
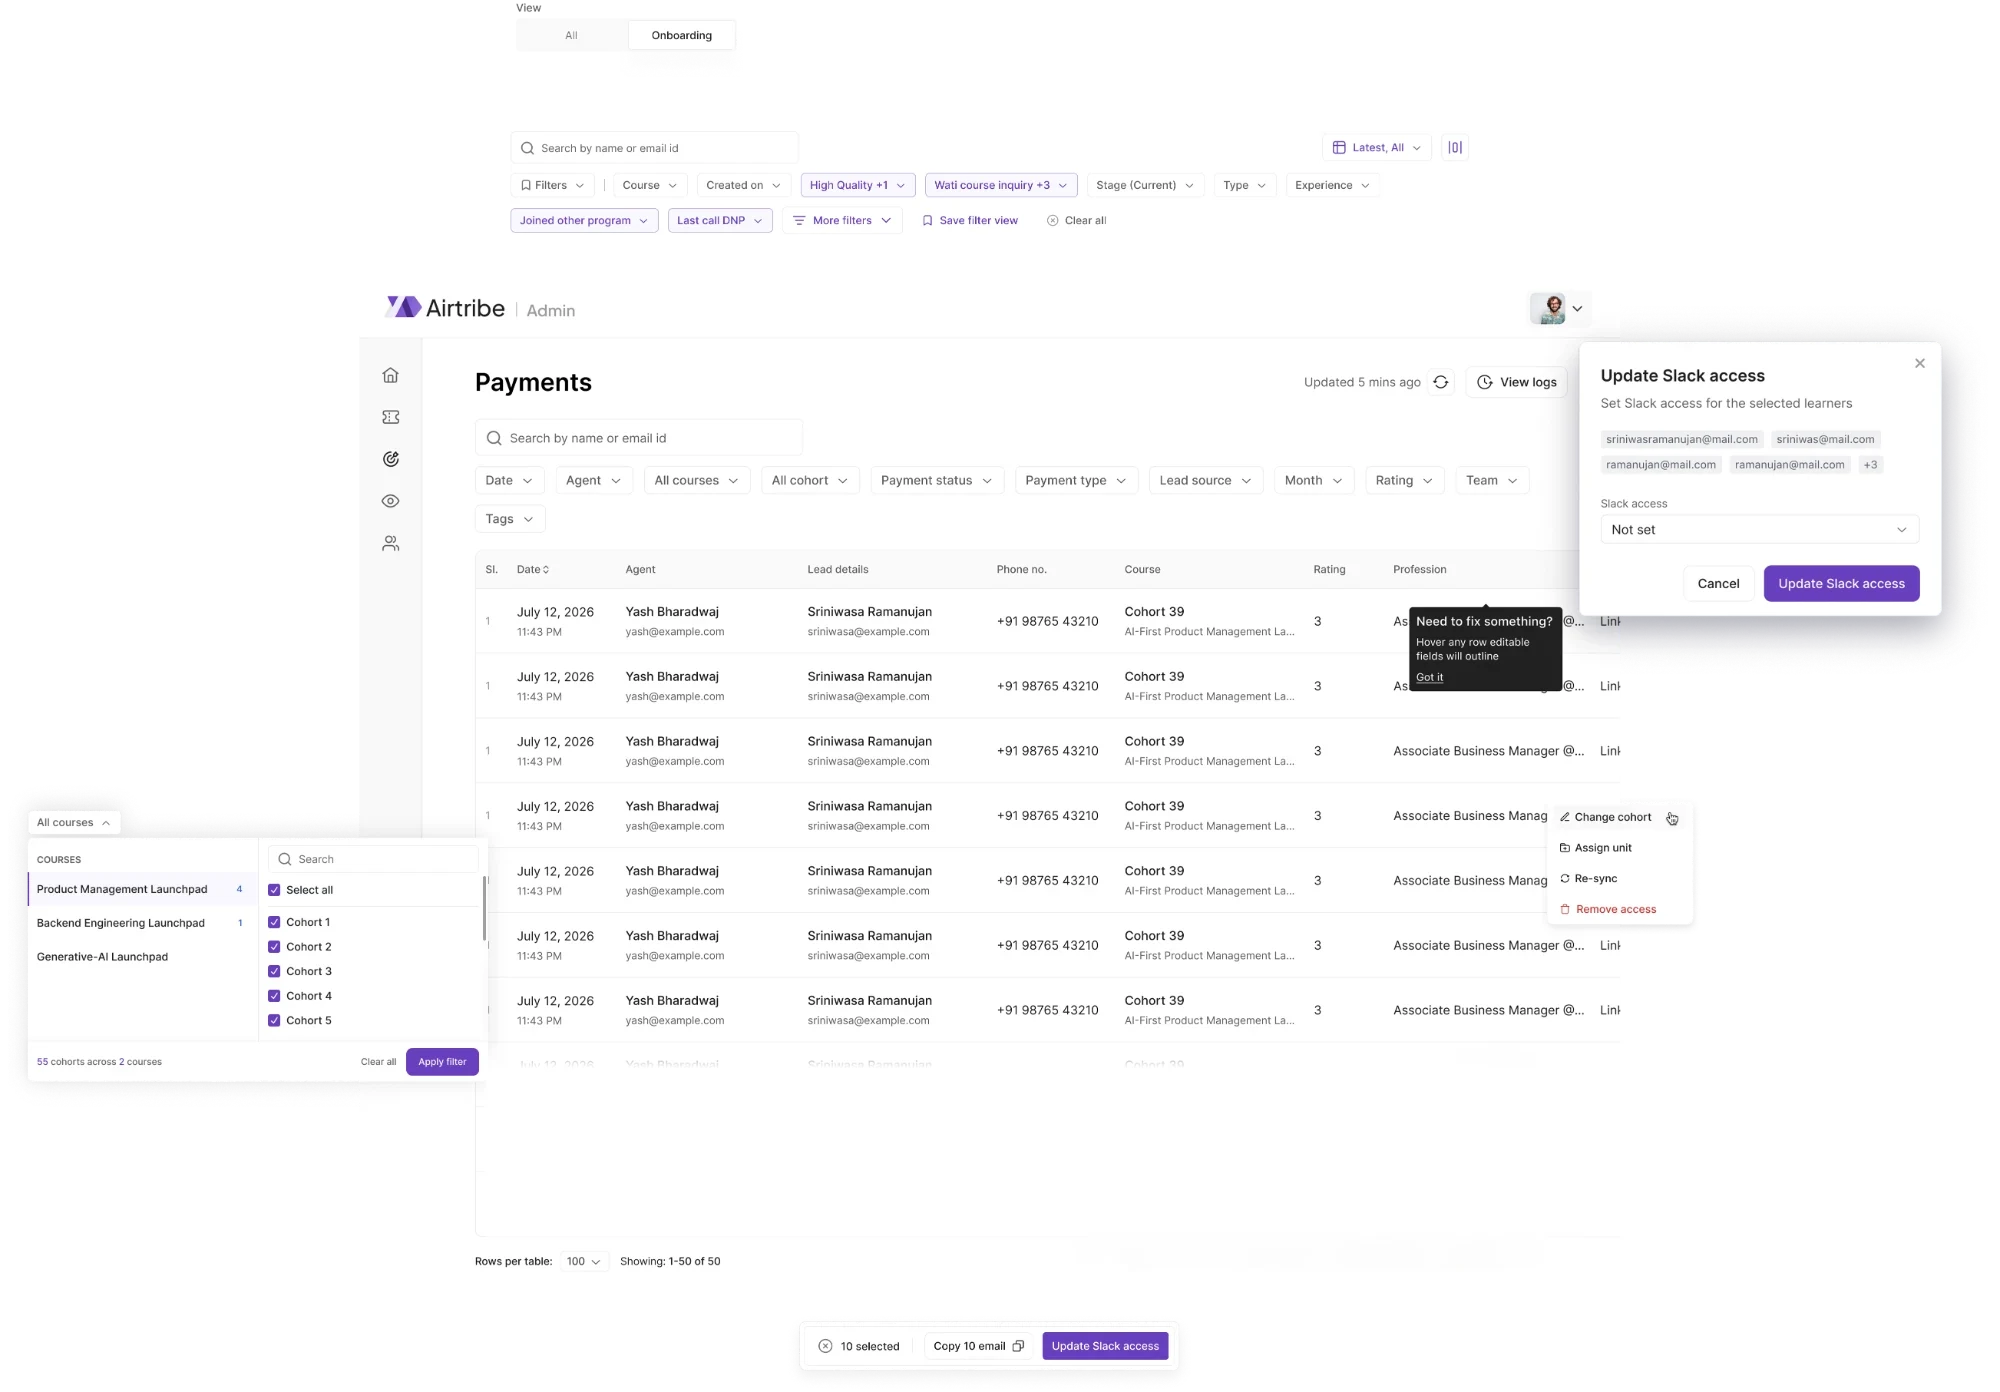
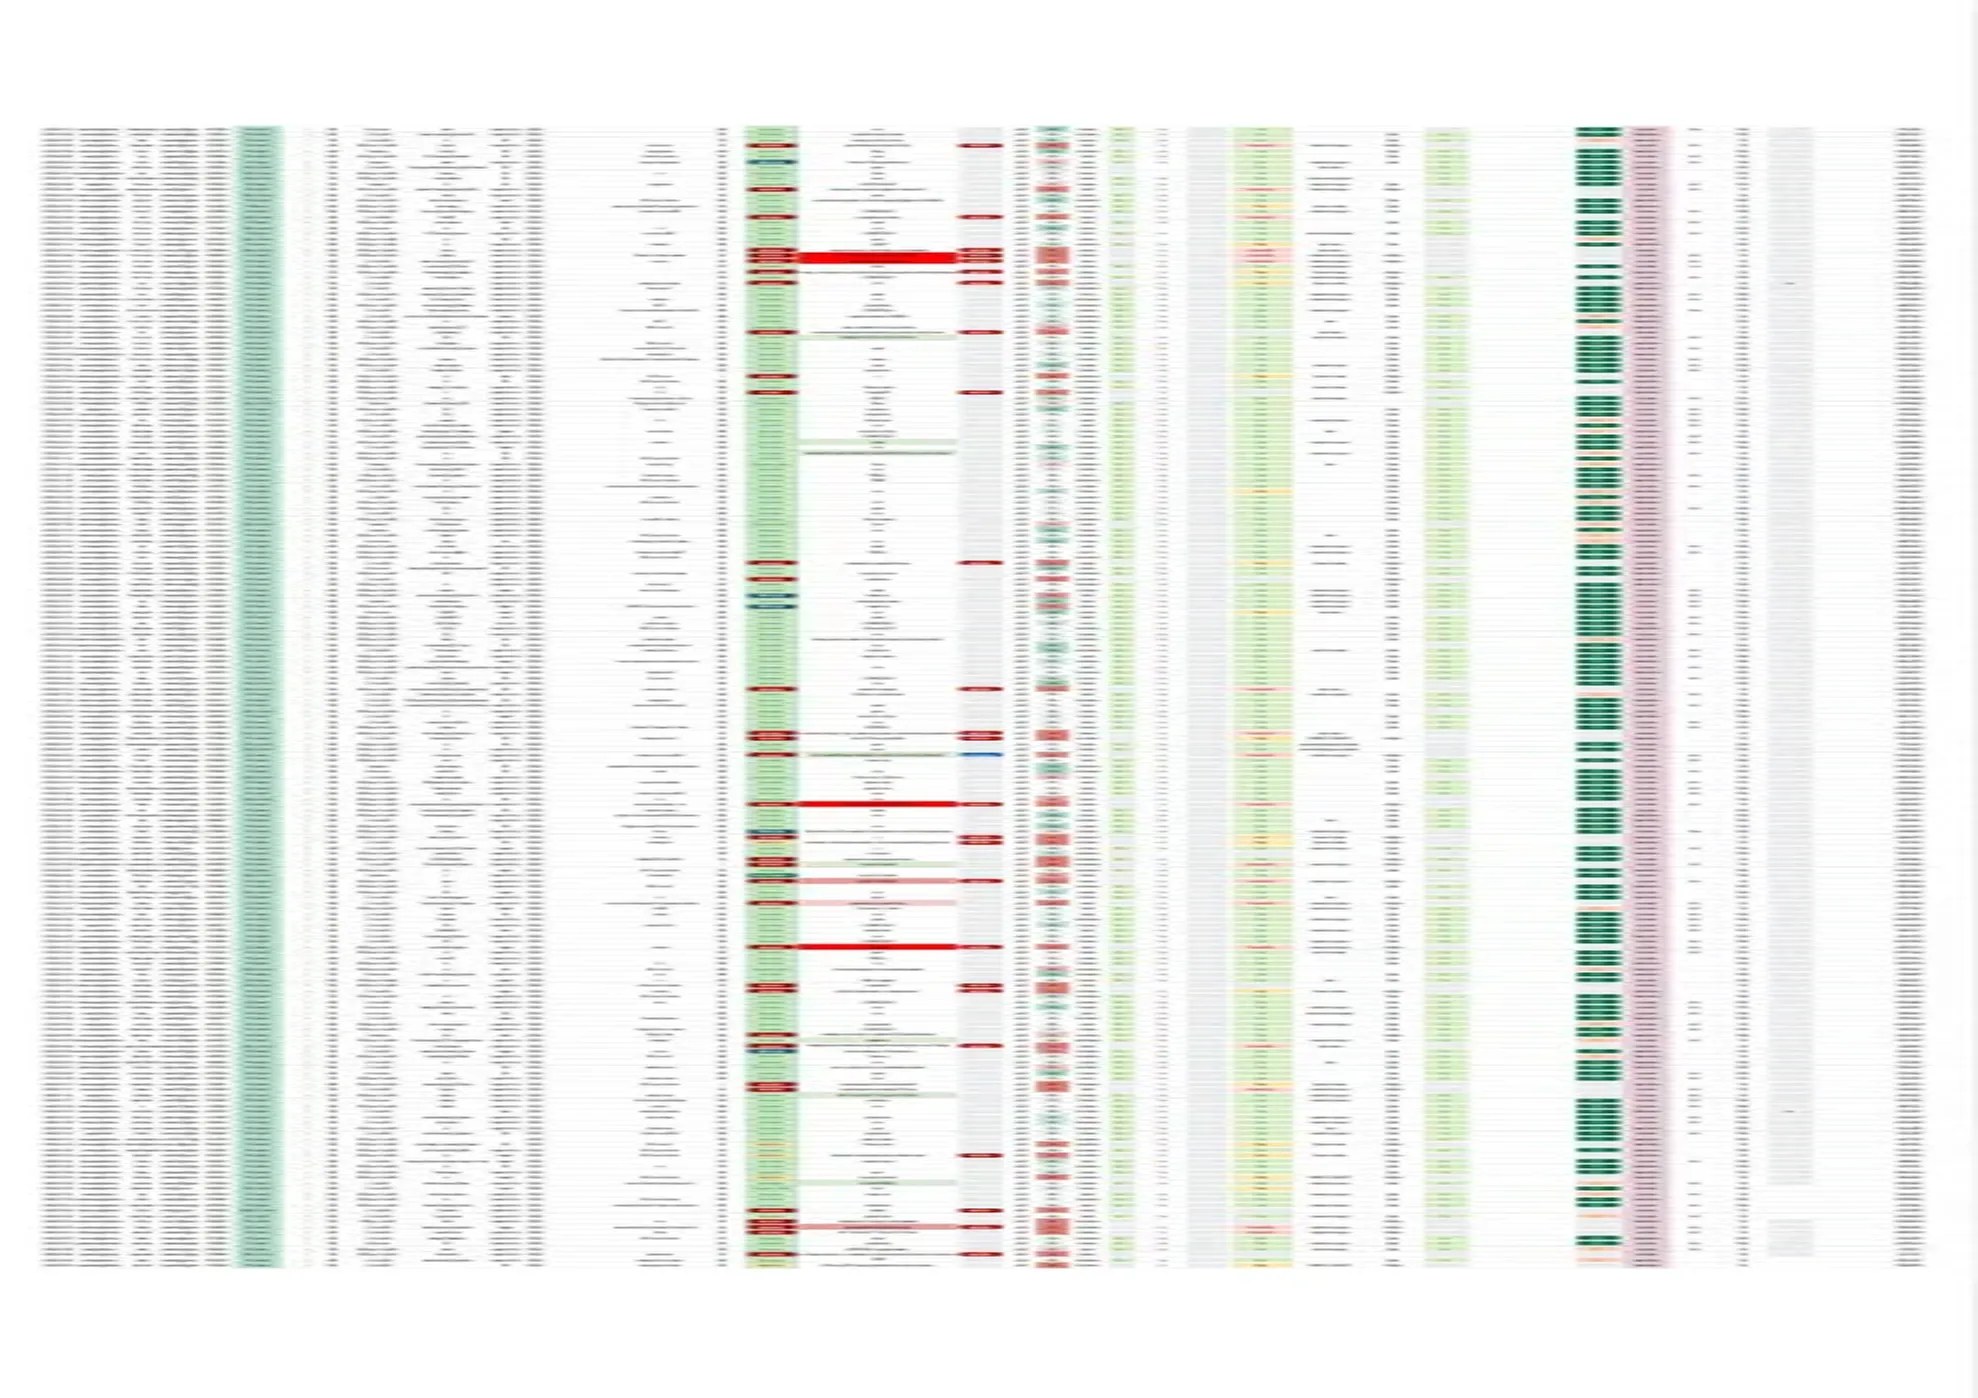
the whole company's payments ran through a google sheet. moving them into airtribe's internal sales and operations product, in three phases, without the sheet ever going dark.
- role
- product designer
- team
- four: two product designers, one backend, one frontend
- context
- airtribe · internal sales and operations
- year
- 2026
product thesis
every enrolment, instalment and refund the company took lived in one google sheet, and finance, delivery and onboarding all read from it. the brief was to replace it. the harder fact was that nobody was unhappy with it: it was fast, it was visible, and it had never once asked anyone for permission.
role and ownership
two product designers ran this end to end. i took the ground research, the problem framing, the conversations with every team that touches a payment, and the design decisions below; we split the ui screens, and the other designer led the handoff. one backend and one frontend engineer alongside. no researcher and no ux writer, so the column list, the payment states and the dropdown copy are decisions rather than inherited requirements.
vision is airtribe's internal operations dashboard, none of it learner-facing. payments sit at the seam: sales records what a learner paid and how, and enrolment, slack access, onboarding and invoicing all key off that record.
the question
what does a product have to do before someone gives up a spreadsheet they trust?
what the decisions were based on
primary research with the teams
sessions with the sales and lxd people who lived in the sheet, before anything was designed. the column list came out of those, not out of the schema.
clarity session data
how people moved through the existing screens rather than how they described it. this is what made the filter overflow visible before anyone complained.
algolia search data
what people searched for, which told us which fields were being filtered by hand because no filter existed yet.
testing with the same people
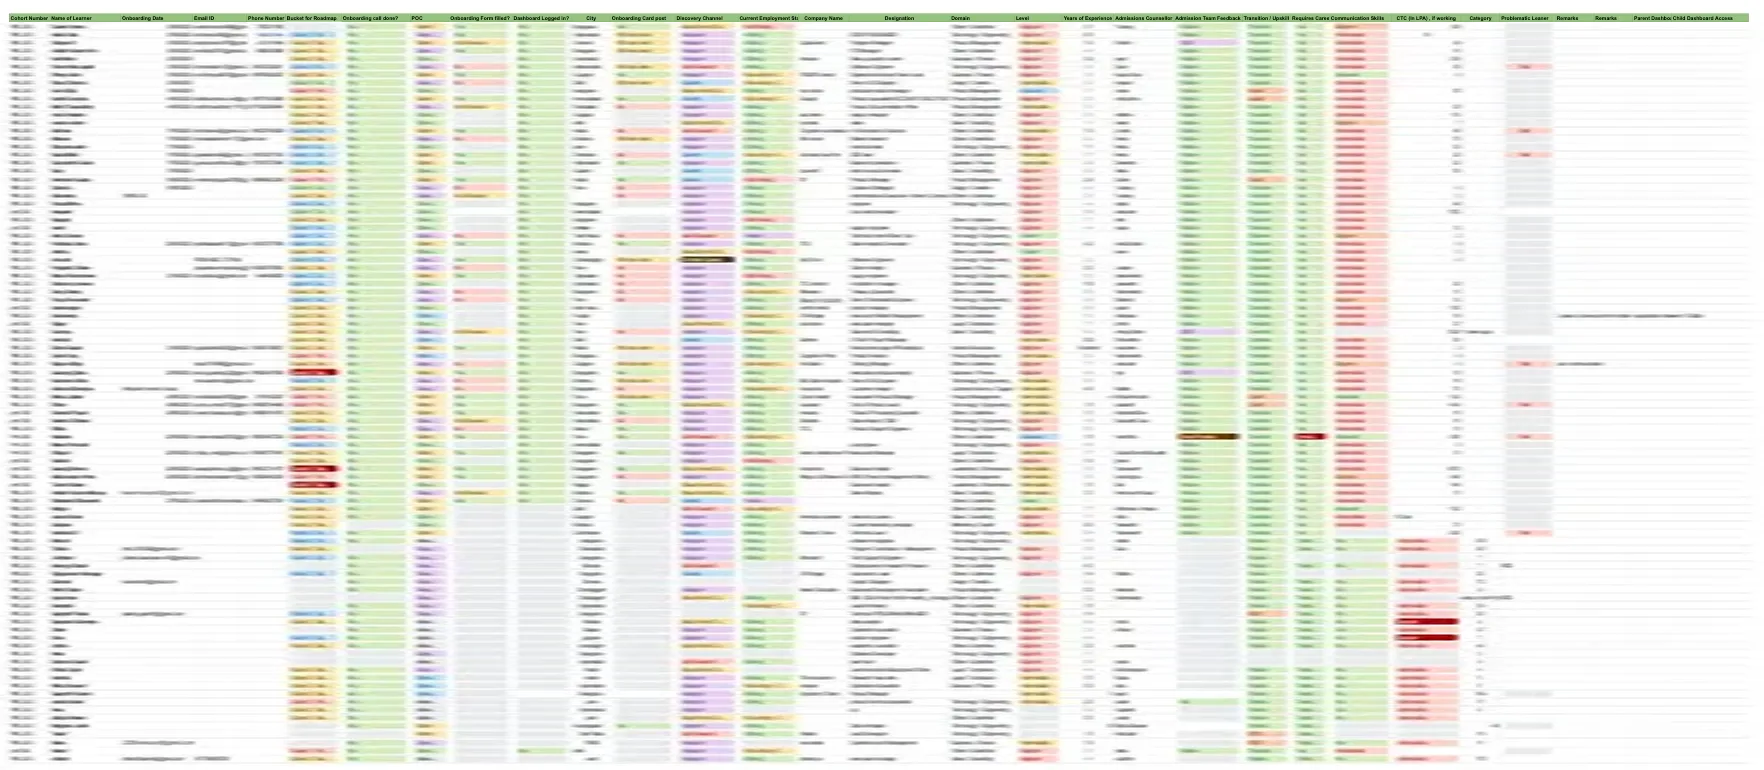
every phase went back to the teammates who would use it. onboarding changed most: unused columns were deleted, and several that were really a sequence of tasks became a checklist.
the decisions that shaped the screen
a table, by default
why
the sales team had spent years in a grid. opening on cards or a form would have made every one of them slower on day one, which is when a replacement earns trust or loses it.
tradeoff
a table is the least forgiving layout there is, and it commits you to solving density everywhere else: filters, views, permissions, overflow.
result
nobody needed a re-learning period. the work went into making the table hold more than a sheet could.
views instead of one table
why
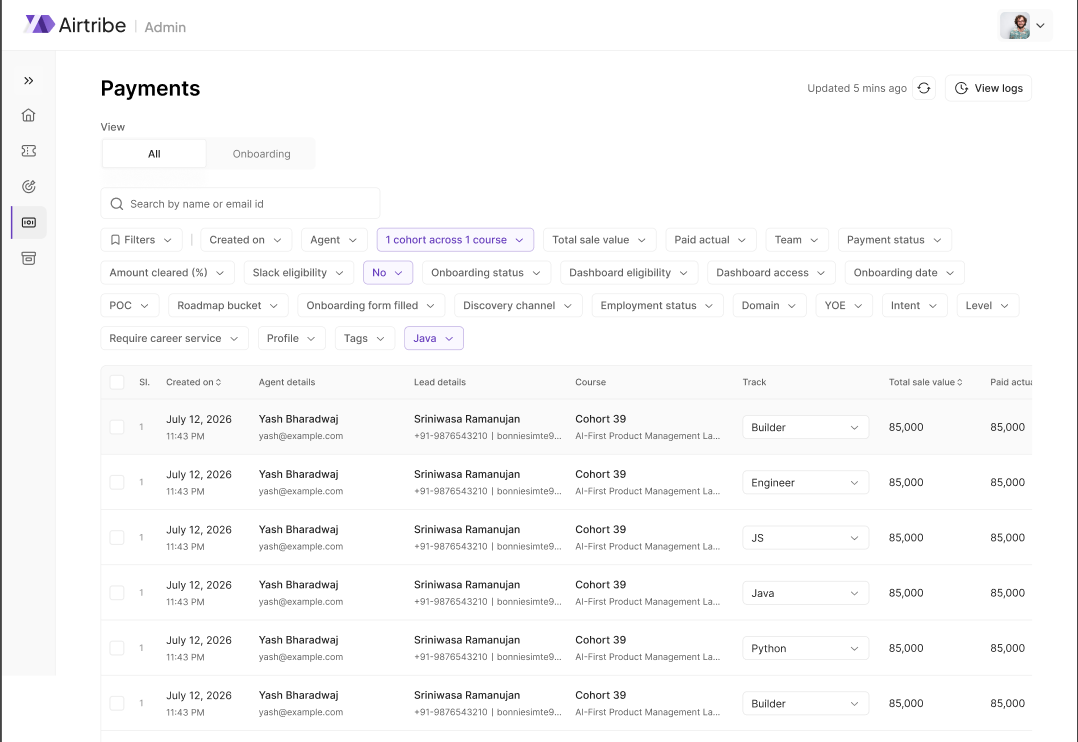
by phase 3 a payment carried slack access, dashboard access, an lxd comment and the onboarding sheet as well. one table meant both teams scrolled past two thirds of it to reach their own third.
tradeoff
views split a shared surface, and a shared surface was half of why the sheet was trusted. so they overlap deliberately, and an all view stays available.
result
sales, lxd and all, with the columns inside each one governed by role and permission rather than by preference.
friction proportional to consequence
why
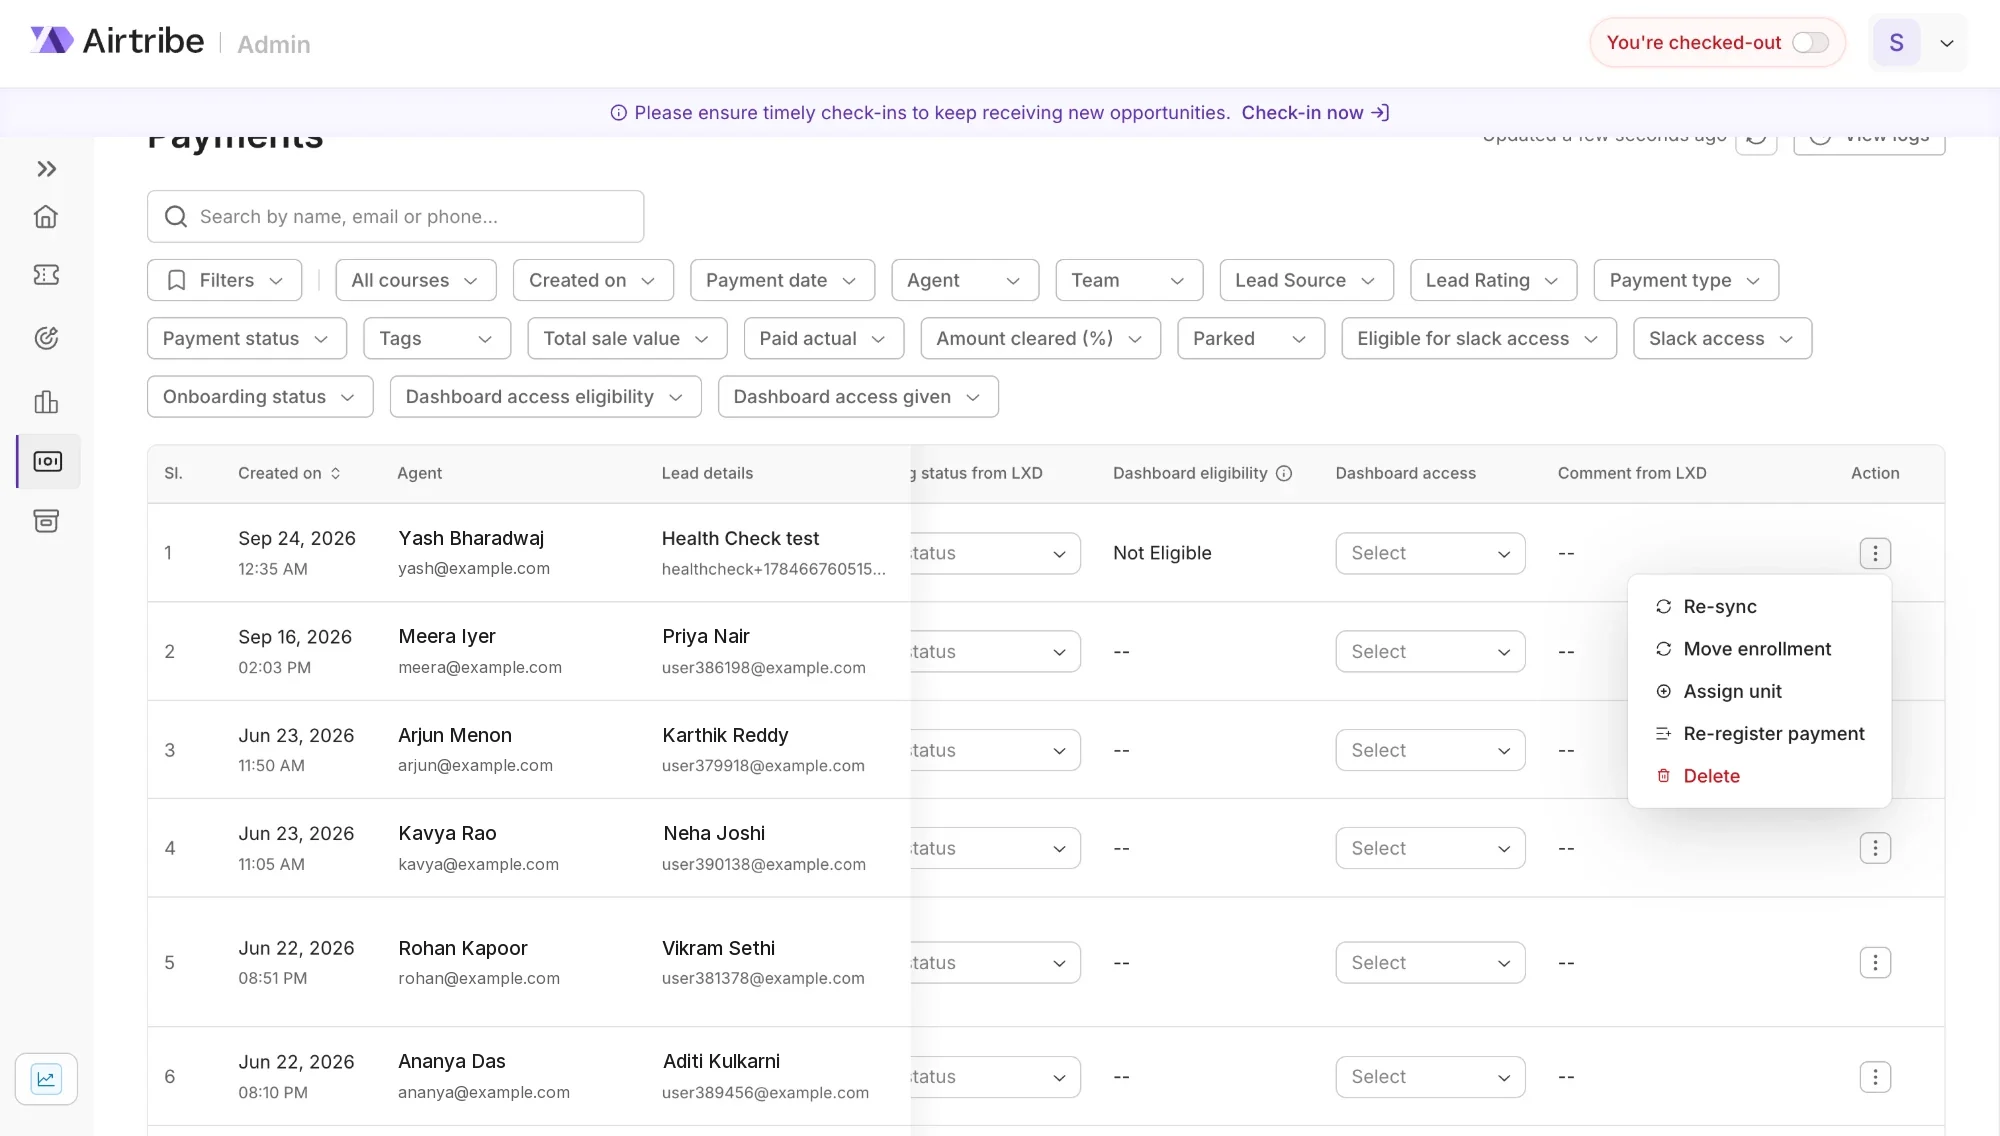
a typo in a comment costs nothing; a change to a payment status moves money and triggers access downstream. a spreadsheet treats both identically.
tradeoff
every piece of friction is a slower edit for someone who knew exactly what they were doing.
result
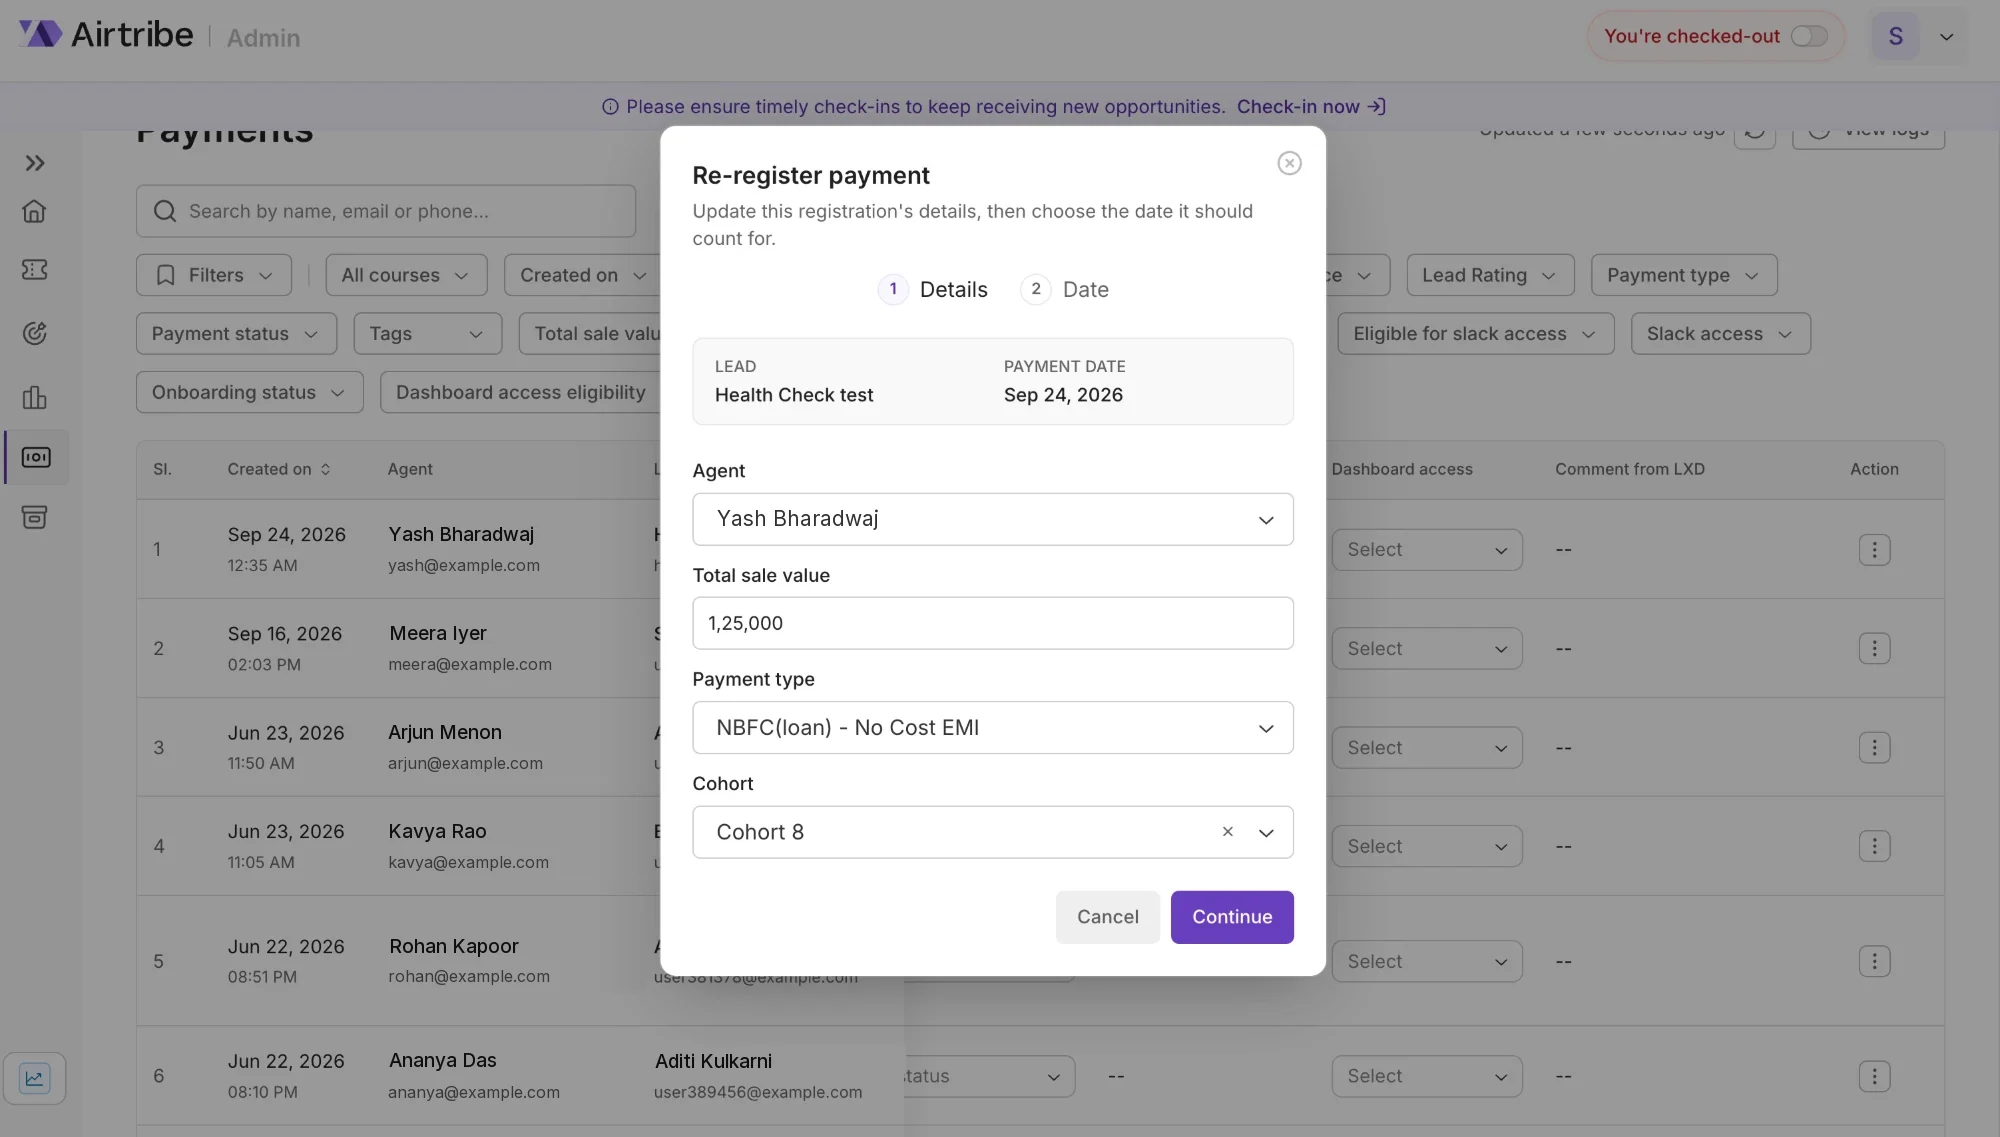
each column is either directly editable or behind an action button that names what is about to happen, and that menu is role-dependent. change logs sit alongside, so a row can be asked who last touched it.
an action that says what it does
re-registering a payment moves money, so it is a dialog in two steps: the details, then the date it should count for. the lead and the original payment date stay pinned at the top, where they cannot be edited by accident.
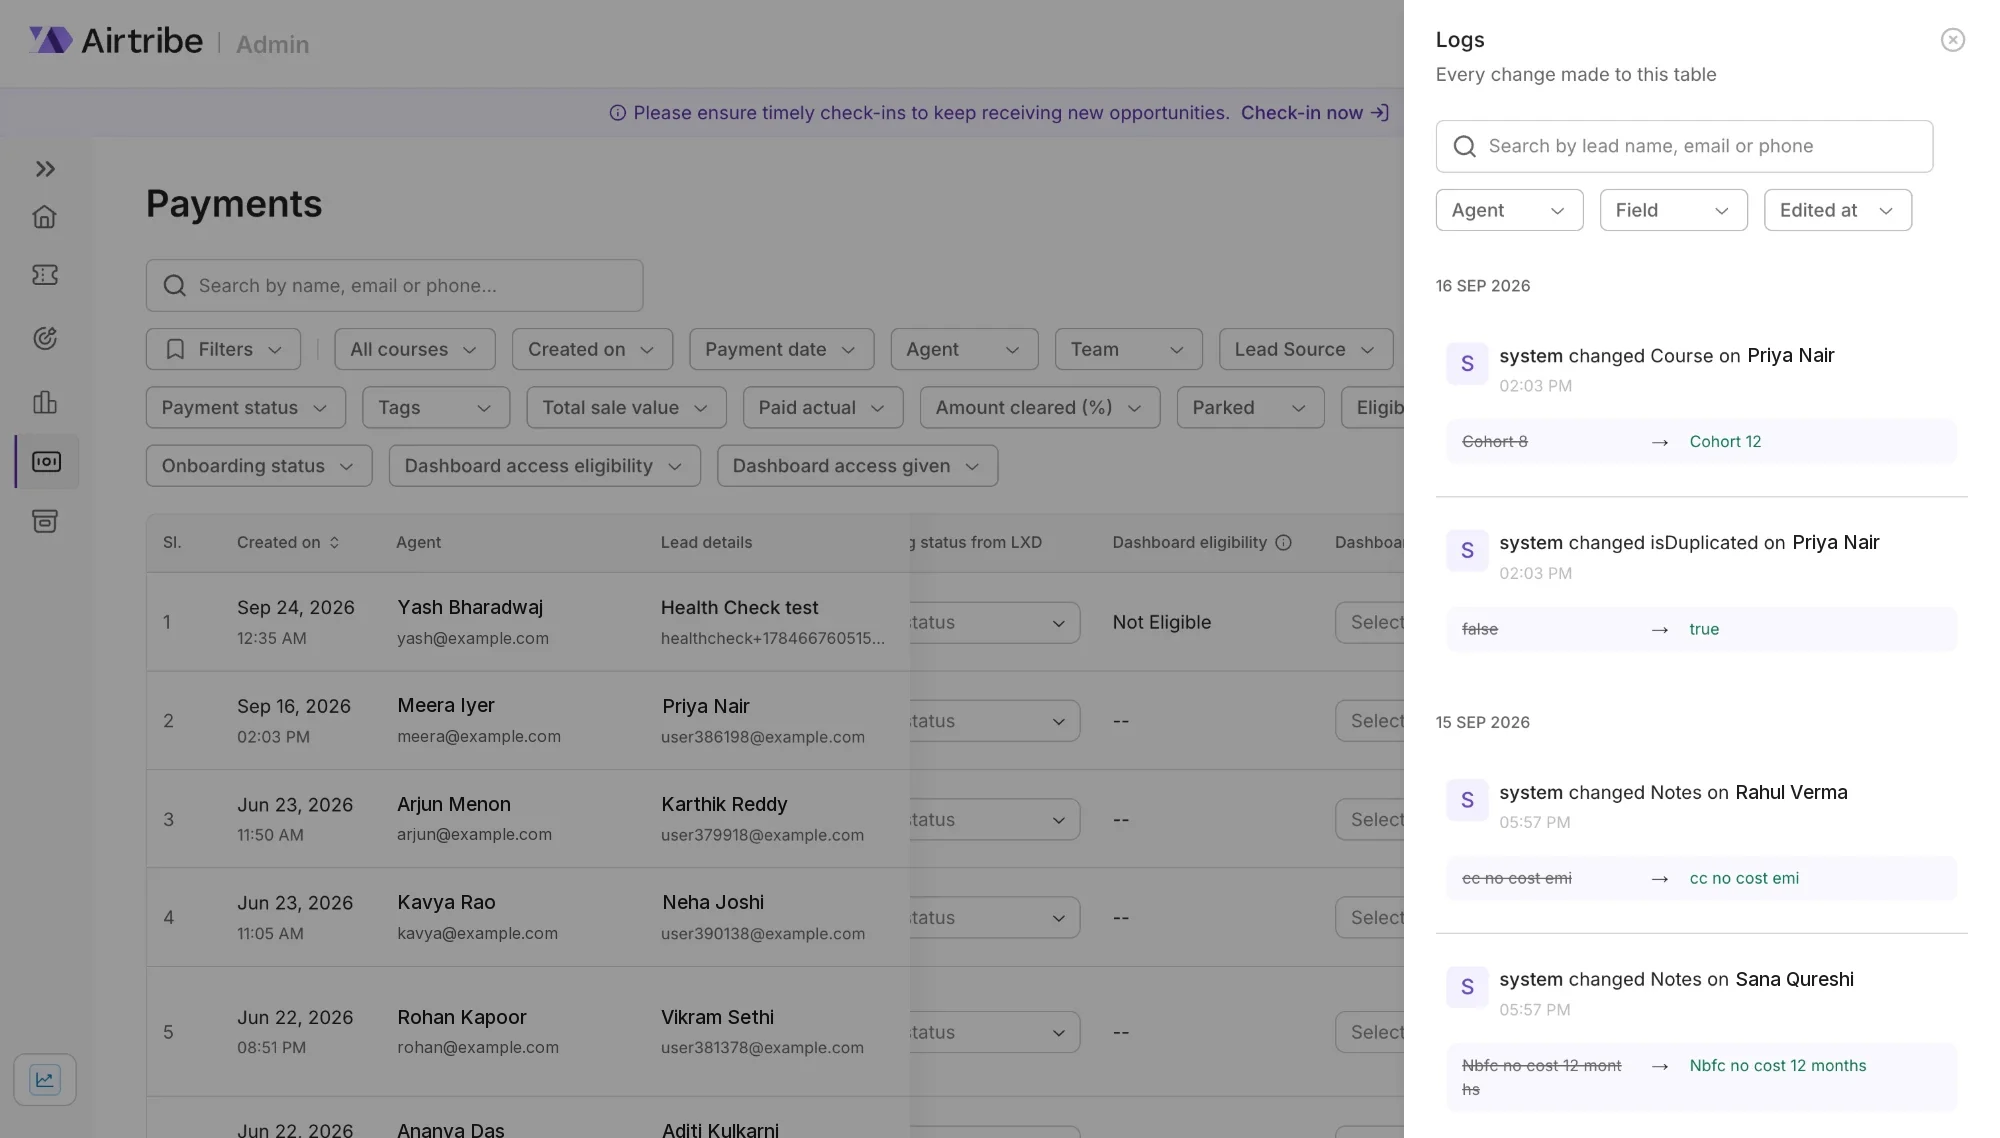
who touched it, and what it was before
every change to the table, searchable by lead and filterable by agent, field and date. the old value is struck through beside the new one, so a disputed row is answered in one look rather than a slack thread.
three phases, in the order they shipped
phase 1 · the sales sheet
the payments record, moved into vision as a table.
sales first, because it is the team that creates the record rather than one of the teams that reads it
phase 2 · widened for lxd
a confirmed lead goes to lxd for final payment, slack access and dashboard access, so the record widened to carry them.
this is why a payments row now holds an lxd comment and two access states: the sheet had already put them there
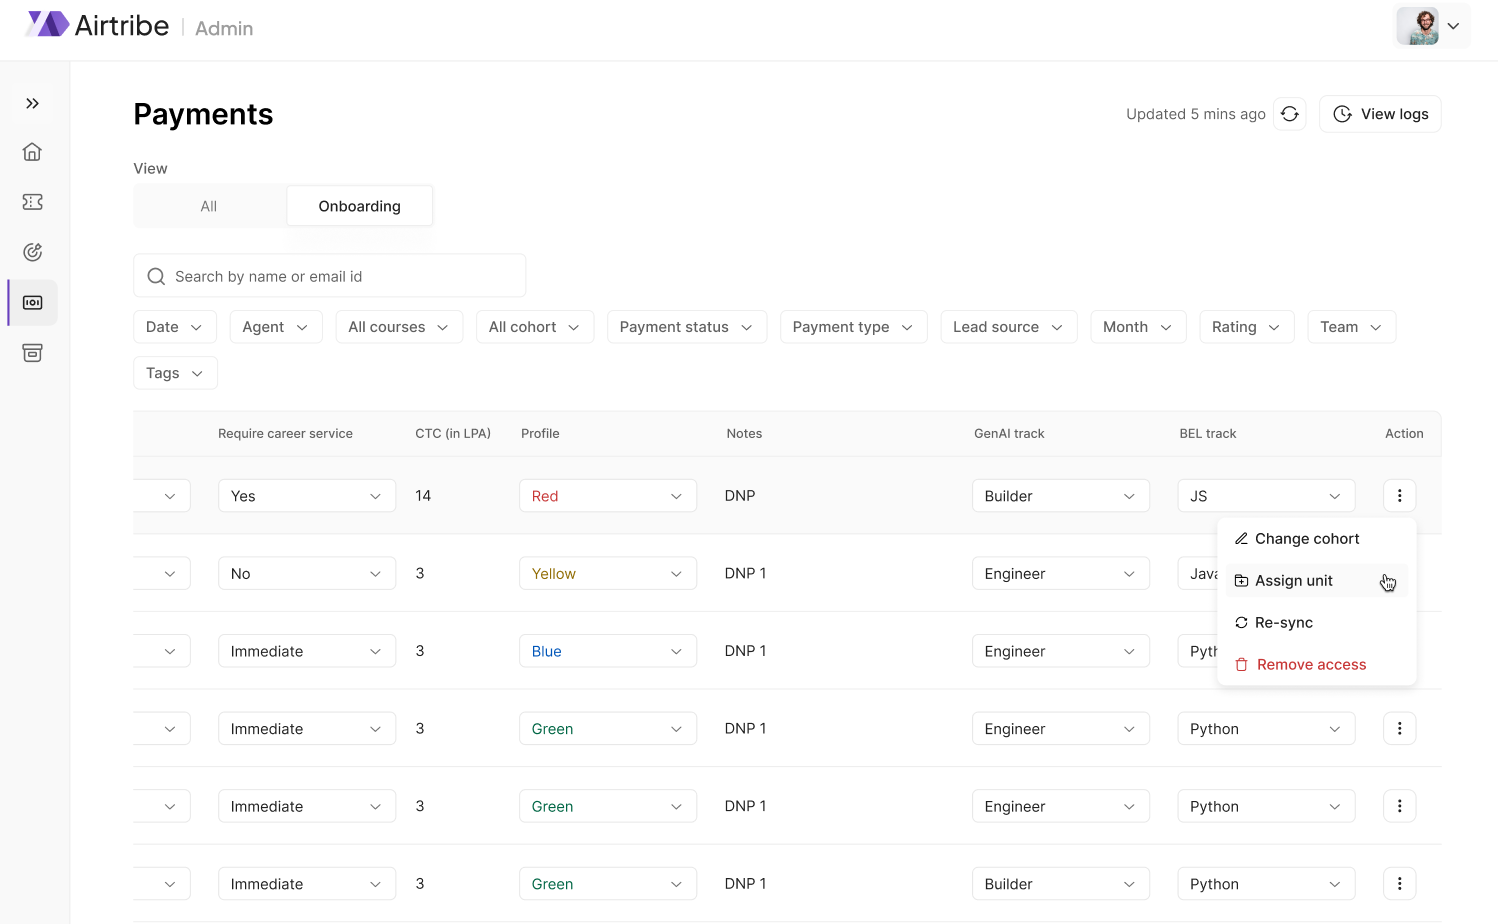
phase 3 · the onboarding sheet
onboarding folded in on the same pattern, and the combined table became too long to be one table.
this is the phase that produced views, and the phase where testing deleted columns rather than adding them
scroll the run →
staged rather than migrated at once. the sheet was live money the whole time.
what one payment record has to hold
a payment is an amount, the instrument it arrived by, where that instrument is now, and what each downstream team may do next. the statuses are not a pipeline, they are the states a real payment gets stuck in. the row spans sales, finance and delivery, for people who each care about a third of it.
- paid in one shot
- → cleared, or still pending verification
- part payment
- → part paid by airtribe, or awaiting the rest
- credit card, no cost emi
- → will pay by credit card, then cleared
- credit card, cost emi
- → same path, different maths
- loan, no cost emi
- → pushed for loan, documents, approval, disbursement
- loan, cost emi
- → or rejected, which is its own state and not a failure of the form
it also carries slack access, onboarding status, an lxd comment and dashboard access. phase 2: other teams' columns inside a sales record, because that is where the sheet had put them.
measure
- payment types6
- payment statuses11
- fields on the record~18
- teams reading the same row3
the decisions the screen had to make
constrain anything with a definitive answer
every field with a finite set of correct answers became a dropdown. this is what made filtering possible at all: you cannot filter a column eleven people have spelled eleven ways, and the sheet had several.
colour is for spotting, not reading
only the anomalies carry colour: likely to refund, confirmed but not paid, loan rejected. the ordinary states do not, because if everything is coloured nothing is.
sync is a state, not a success message
reconciling with the sheet resolves six ways: created, pulled in, already in sync, not found or not permitted, failed, or ambiguous. ambiguous is the one that matters, because a person at 6pm has to be told which record they are looking at and which they are not.
a rejected loan is a state, not an error
loan rejected, access removed, awaiting documents and waiting for disbursement are ordinary places a payment sits. as error states they would say the agent had done something wrong.
the same learner, twice, on purpose
a learner who re-enrols is a second payment record, not a correction of the first, so duplicates by name are legitimate and cannot be merged away. the latest carries a live badge; the older ones stay readable.
the same name leads two different places
the same lead opens the opportunities page for sales and the learner profile for lxd. the row is shared; the job you are doing with it is not.
the flaw we shipped
first direction
a name and an email are never read apart, so we merged them into one cell: name on the line, email as a subline. it tested well with the sales team and gave back a column on a table that needed the room.
what happened
it broke a workflow nobody had shown us. the people granting slack access take the whole column at once: one drag, about five minutes for a cohort. as a subline there was nothing to select, so it became copying by hand, about fifty minutes. we had researched the team that writes the record and missed the team that reads it a hundred rows at a time.
what changed
the email came back out as its own column, and the rule came with it: a column is not a field, it is a workflow. every merge candidate now gets a second question, not is it read beside its neighbour, but is it ever selected, sorted, exported or copied alone.
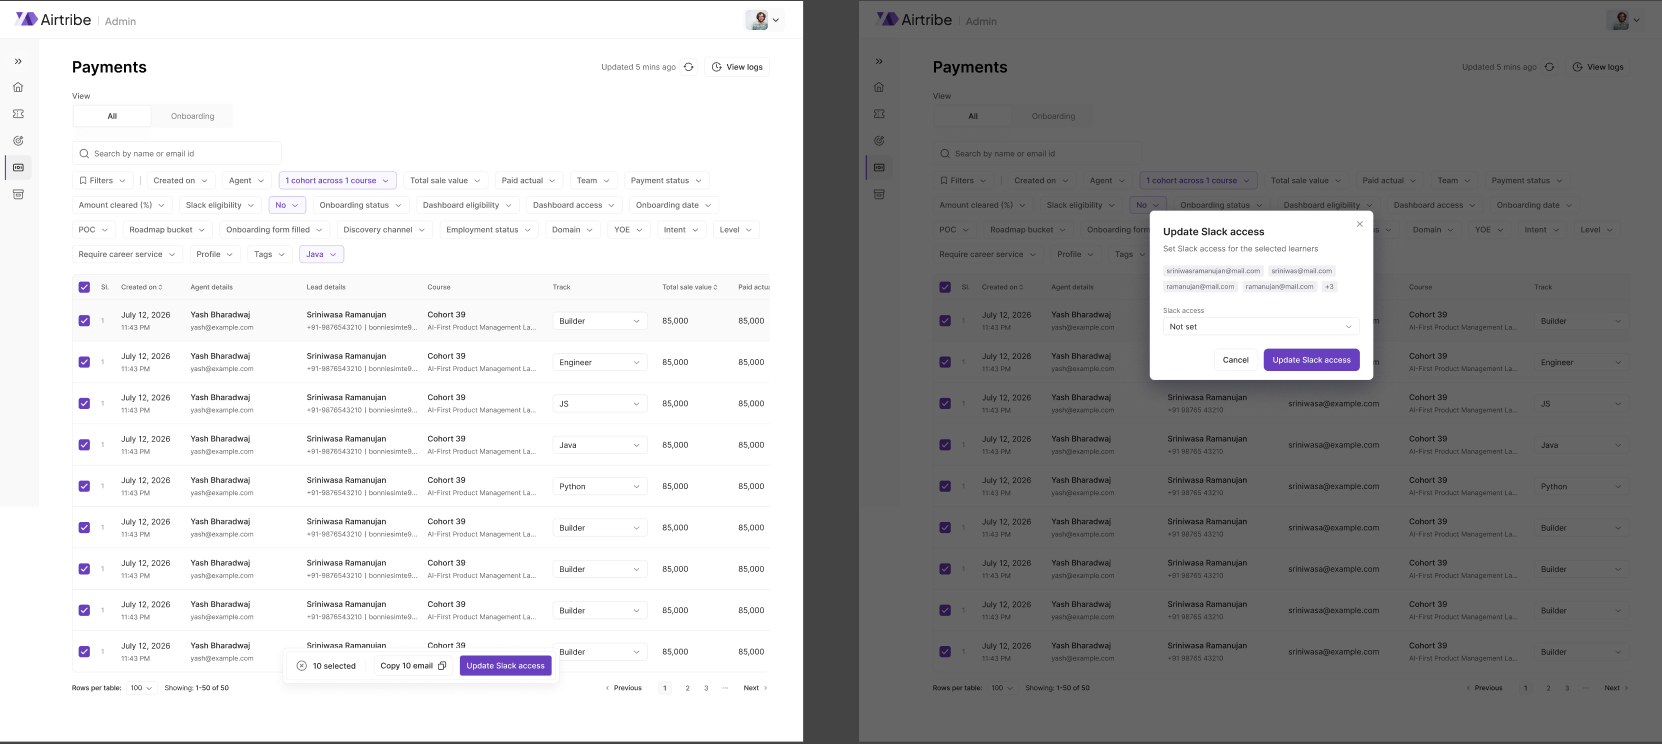
filters, and a chicken and egg problem
an opportunity carries about twenty five fields across three lifecycle axes people mistake for one: a status, a stage, and a separate lead status. showing all of them was the overflow; burying them two clicks deep would have made the product slower than the sheet at the task the sheet was worst at.
so the filter set stopped being fixed. a new user gets recommended filters, then the bar shows what they last used, and the rest expand in place. a combination worth keeping becomes a named view. search gained include and exclude, to stop a query quietly returning the wrong queue.


email templates, for managers and agents
the same product, a different muscle. templates are what the sales team sends from, and the design question is not the editor, it is the line between the two roles: what a manager can author and what an agent can only send. it is the same question the permissions work below asks at the level of the whole product.
who is allowed to see what
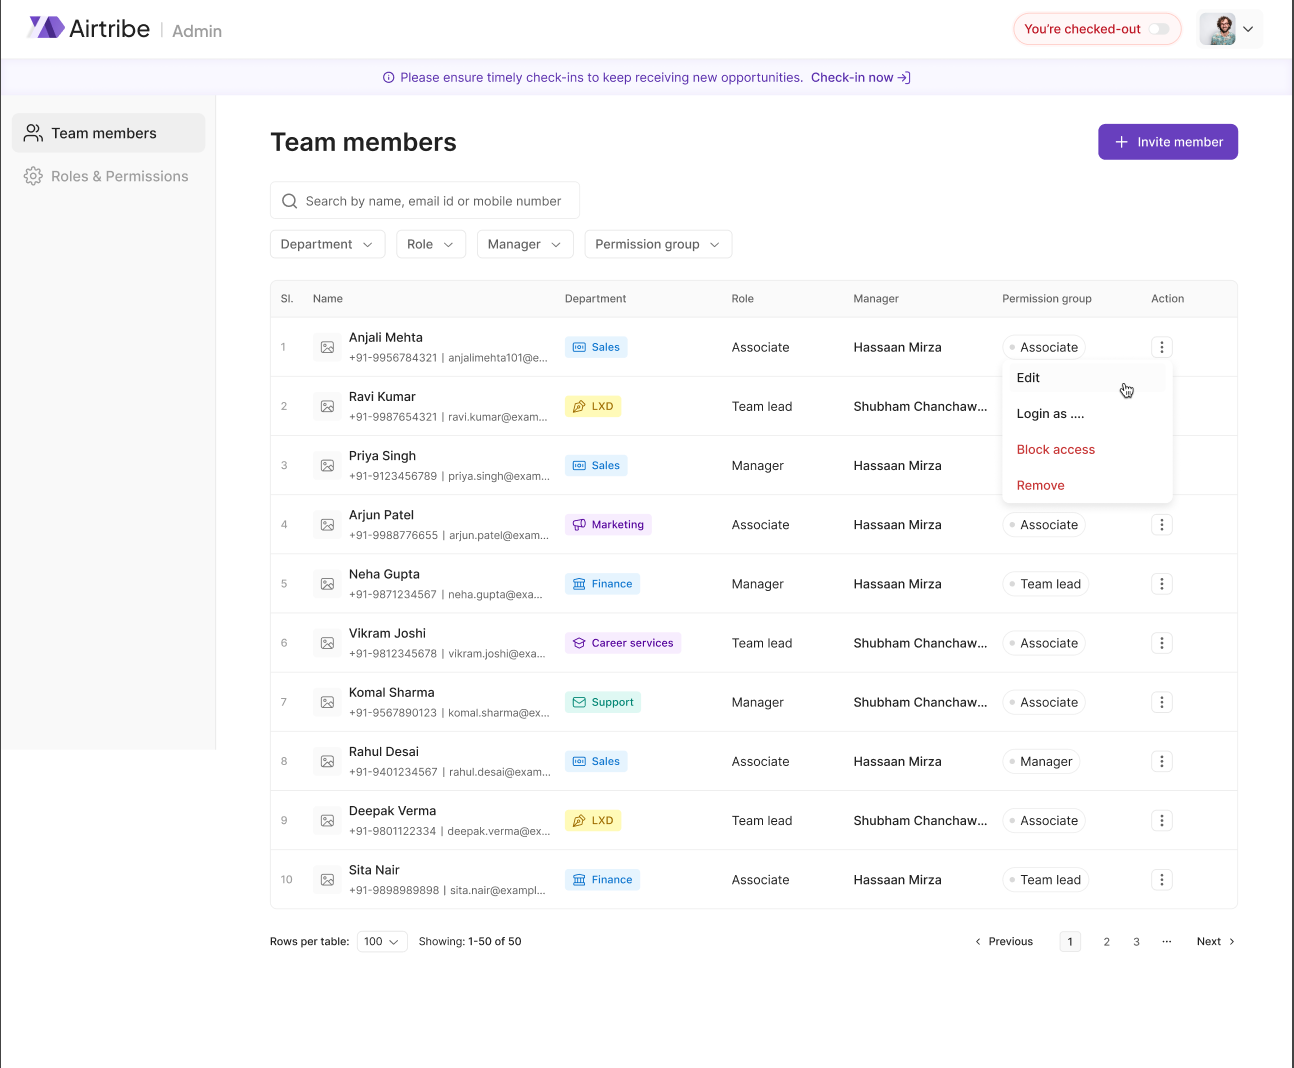
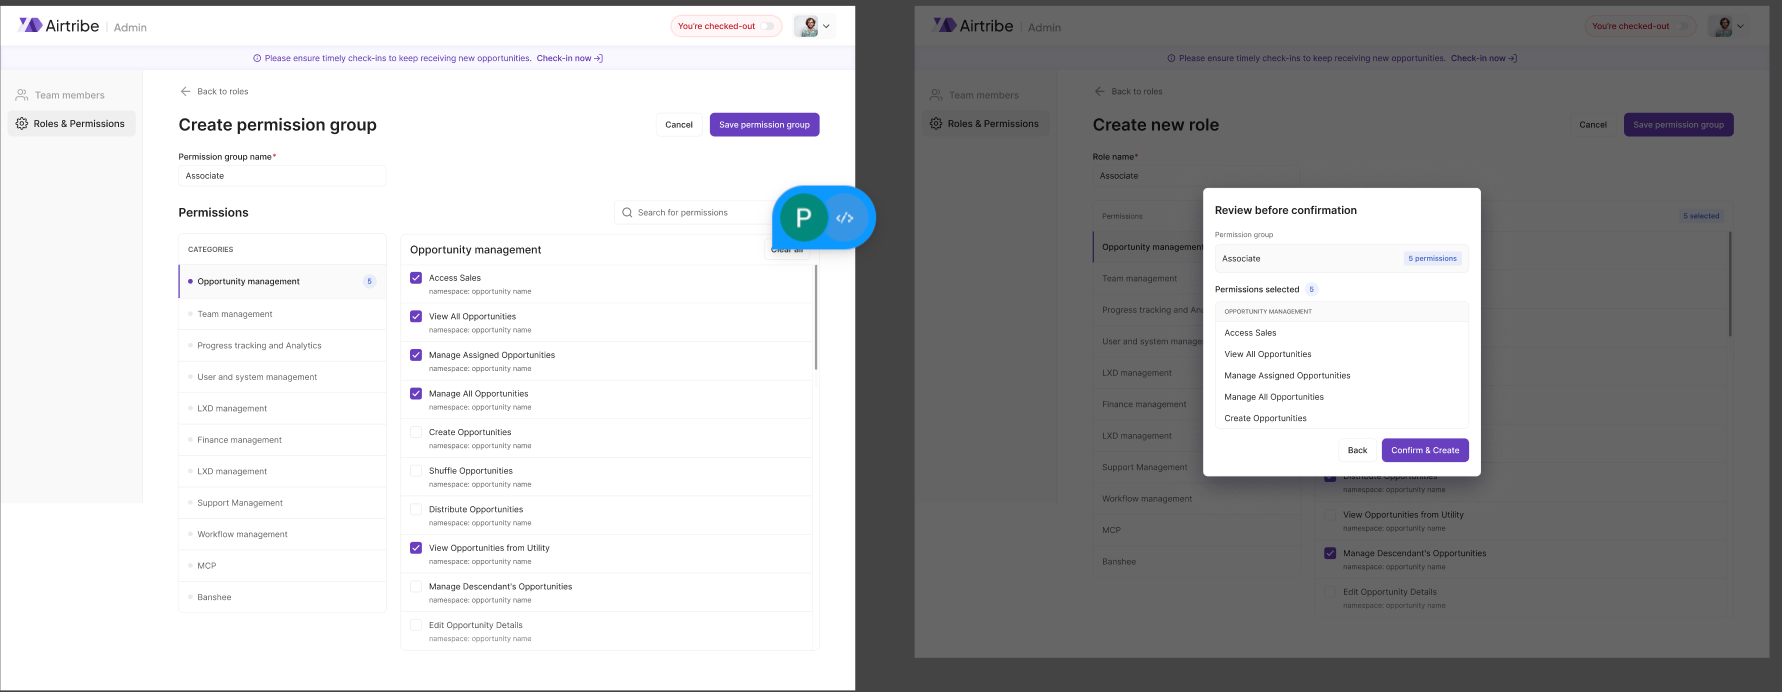
almost nobody should see the whole row, so access runs on four axes that are deliberately not the same thing: department, role, permission group, and who you report to. a title is not a permission.
permissions are namespaced into eleven categories and compose into named groups rather than being handed out one at a time. it took the longest to argue for, and it is what makes every other decision on this page enforceable: views, editable columns and the action menu all read from it.
a spreadsheet's real advantage is not that it is flexible. it is that nobody has ever had to ask it for permission.
outcome
the sales sheet is no longer the source of truth. three spreadsheets across two departments are now one table carrying the whole lead lifecycle, first payment through to onboarding into the lms. all three phases shipped, alongside the email template flow, the cohort filter and the filters and search redesign.
views and role-based permissions cut scroll depth in half, and accidental edits dropped once a row could be asked who last touched it. the sales team moved off the sheet with no re-learning period. onboarding ended with fewer columns than it started with. the one workflow the design broke, bulk-copying emails, went from five minutes to fifty before it was caught.
want the full story?
the rest of vision, the opportunities pages, the learner profile, the email templates and the permission work, sits behind an airtribe nda, as do the research sessions and the phases that were tested and cut. i can walk through it privately.
reflection
the first phase went on matching the sheet rather than beating it, and everything after on the two things it structurally could not do. i think that order was the whole job. the sync states are the proof of how long it takes: the product had to say already in sync for months before anyone agreed it was the source of truth.