data visualization · self-initiated
a century of villains
an interactive streamgraph tracing how the hindi-cinema villain changed shape across ninety years.
- role
- design + build
- context
- self-initiated · data storytelling
- year
- 2026
about
the bollywood villain is usually argued about one film at a time. this takes the long view: not who the villains were, but what kind of threat each decade cast as the enemy.
495 films hand-sampled across ten decades, each villain tagged by archetype and by whether the threat was personal or systemic.
credits
- research, sampling, tagging, design, build
- evana sajan
- stack
- react · typescript · d3
- sample
- 495 films, ten decades
- status
- live
try it
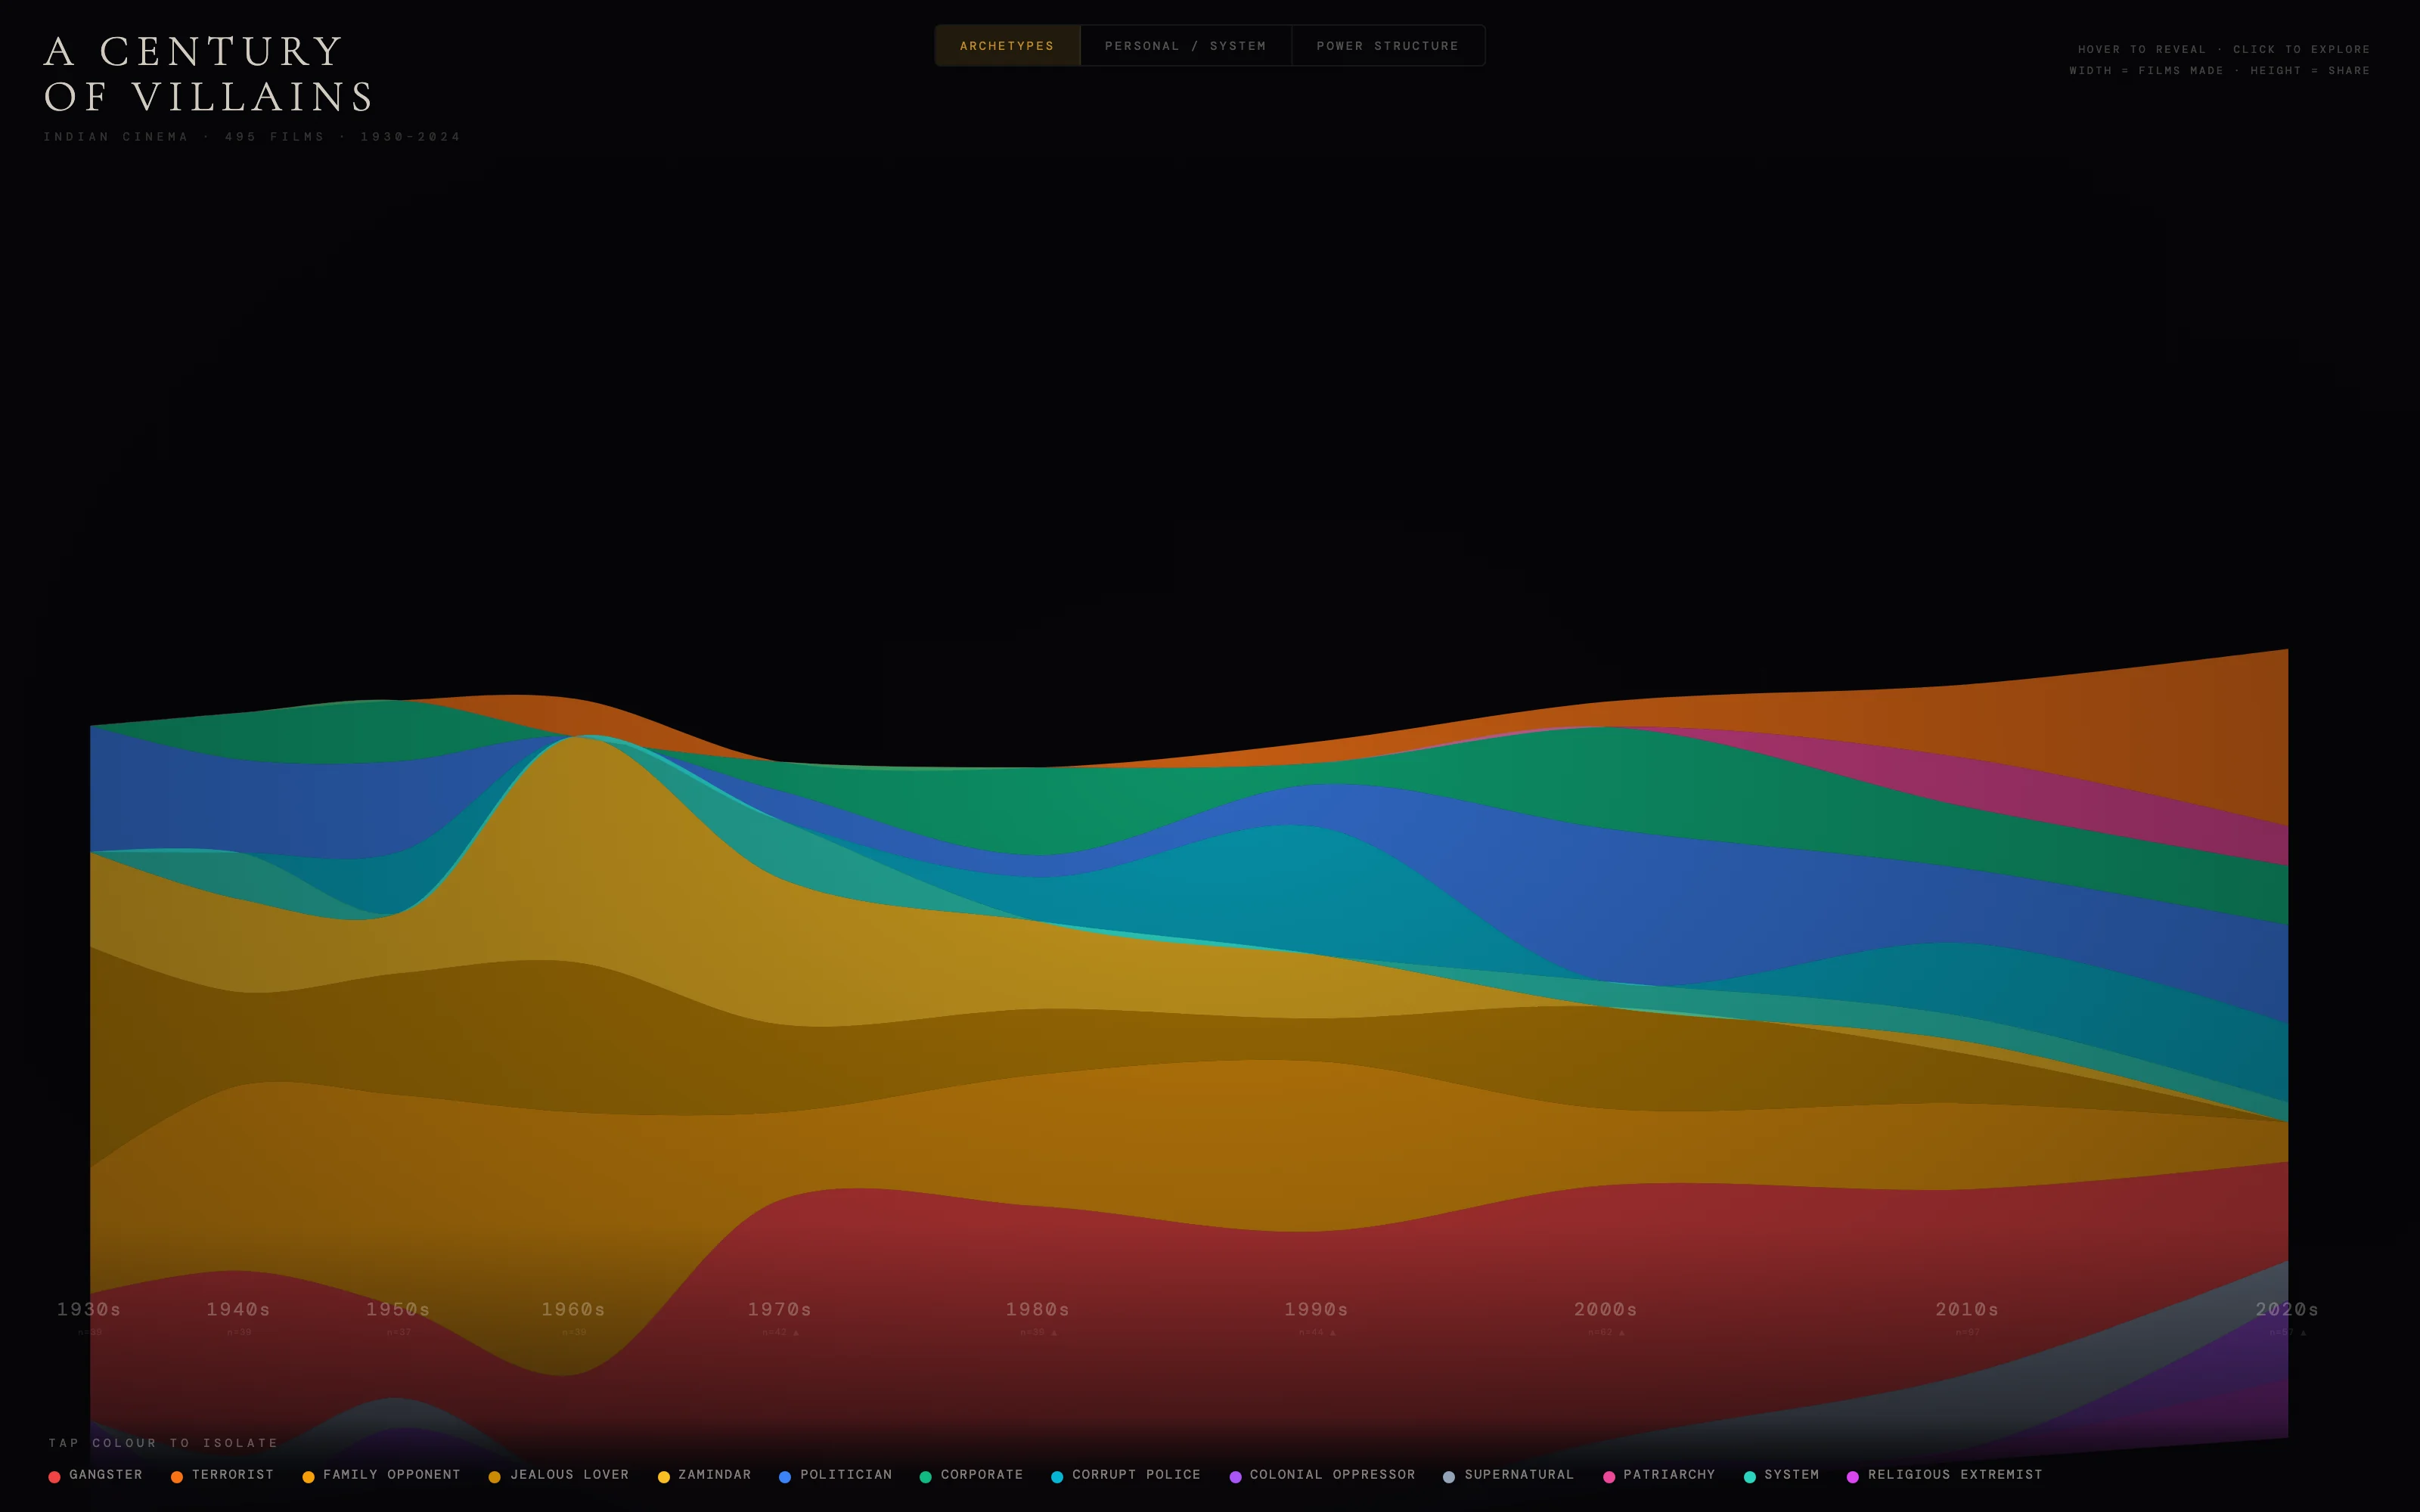
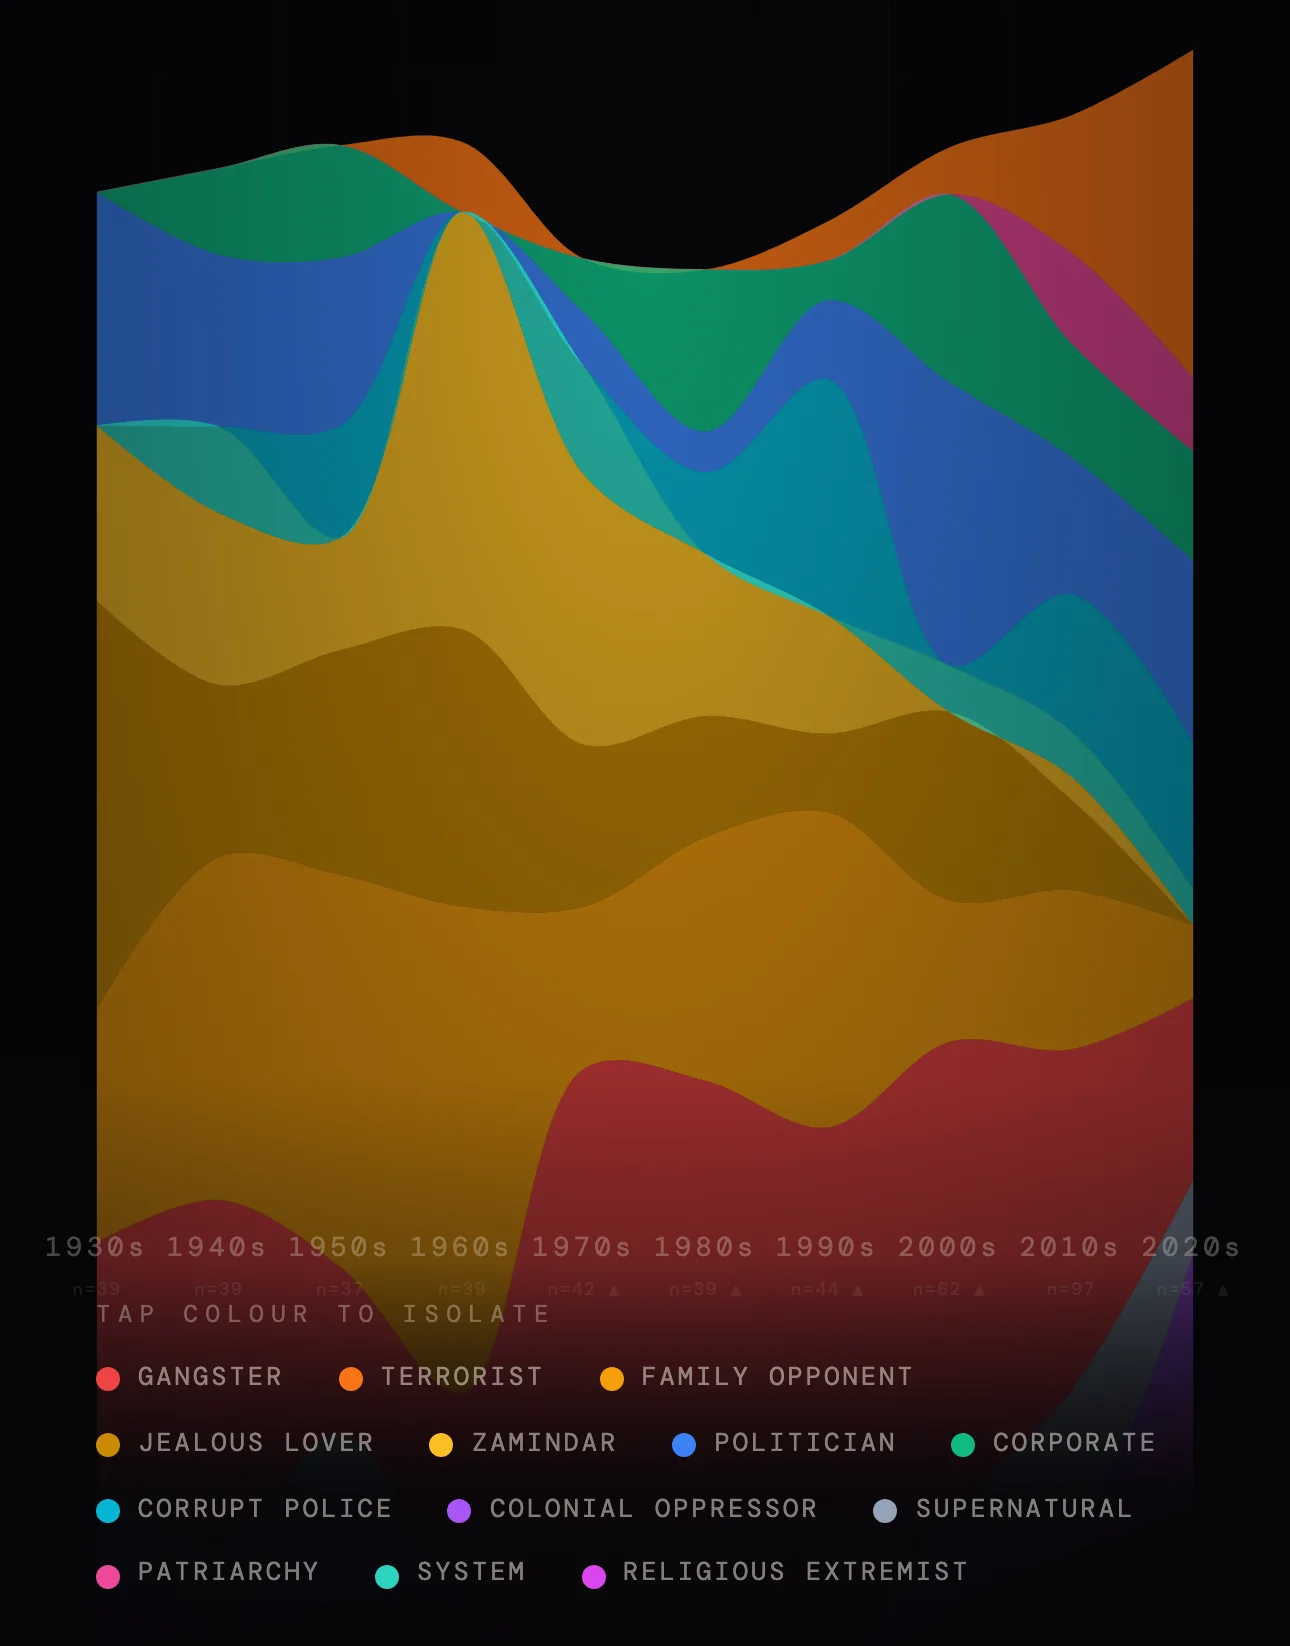
open full screentap a colour in the legend to isolate one archetype across the whole century. hover a decade to get its two voices, the analytical line and the first-person one.
product thesis
a villain is a mirror. i wanted to see what ninety years of hindi cinema had been afraid of, and whether the fear had a shape. it does: the enemy stops being a man and becomes a nation, a policy, a system.
why this one is different
every other version of this argument is an essay about films you have seen.
this one puts a number on it, then spends most of its design budget admitting how soft the number is.
for the first time, the 2020s tip systemic.
the systems thinking
sample
495 films across ten decades, hand-sampled rather than scraped, because there is no clean dataset of who the villain was.
tag
each villain gets an archetype out of thirteen, and a second axis: was the threat a person, or a system.
weight
column width is how many films a decade actually made, not how many i sampled. the chart is weighted by the industry, not by my reading list.
draw
band height is each archetype's share of its own decade, so a decade that made forty films and one that made four hundred can still be read against each other.
key design decisions
encode the doubt into the chart itself
why
a streamgraph is a persuasive shape. left alone it makes a thinly-sourced decade look exactly as settled as a well-covered one.
tradeoff
the piece is less striking than it could be, and it interrupts its own argument to say how little it knows.
result
column width is tied to real output, sparse decades wear a warning glyph, and the caveat sits under the chart rather than in a footnote. most of the design was arguing with the chart about this.
let colour carry the thesis
why
the whole finding is a drift from intimate evil to systemic evil, and a legend nobody reads cannot carry that.
tradeoff
thirteen archetypes is a lot of hues to keep legible on black, so the constraint set the palette rather than the other way round.
result
warm reds and ambers for personal crimes, cool blues and teals for systemic ones. the palette moves warm to cool as the century turns, so you see the argument before you read it.
give every decade two voices
why
a chart states a fact. it rarely makes you feel one, and this subject is half mood.
tradeoff
twice the copy to write, and twice the copy to keep honest.
result
each decade pairs a clipped analytical line with a first-person literary one, so the number and the mood arrive in the same hover.
edge cases accounted for
a decade with almost nothing in it
the 1930s and 1940s are the thinnest samples in the set. they keep their real column width and wear the warning glyph, so they cannot quietly pass as evidence.
thirteen hues on near-black
adjacent bands that read as one colour would invent a trend. the palette was built for separation at small band heights first and for prettiness second.
a phone in portrait
a ninety-year x-axis does not fit a handset. at phone width the piece keeps the legend as the control and lets the chart scroll, rather than squeezing ten decades into 375px and making all of them illegible.
an archetype that barely exists
colonial oppressor is most of two decades and almost none of the rest. isolating one archetype from the legend is the only way to see a band that thin, which is why the legend is interactive rather than a key.